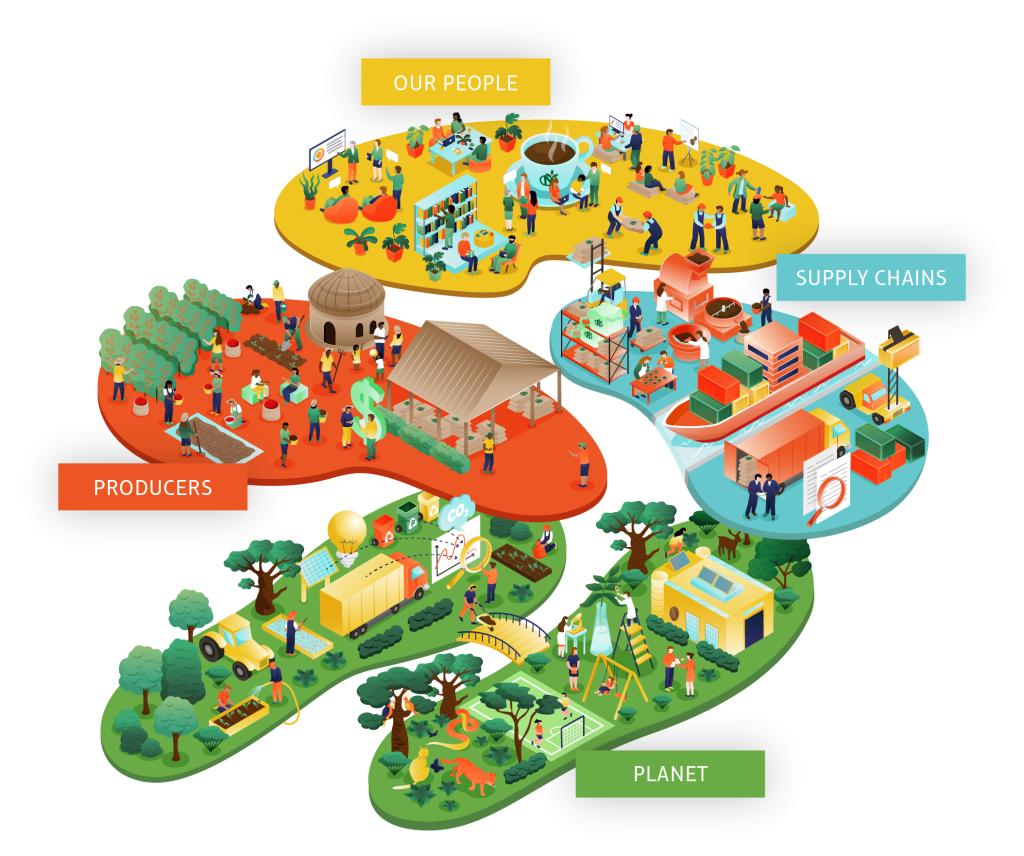
Planet
Measure and enhance our environmental performance
Since the pre-industrial period, the burning of fossil fuels for human activities has caused a temperature increase in the planet’s surface. If business-as-usual activities continue, it is very likely that global temperatures will increase between 2.5°C to 4°C by the end of the century (IPCC, 2021).
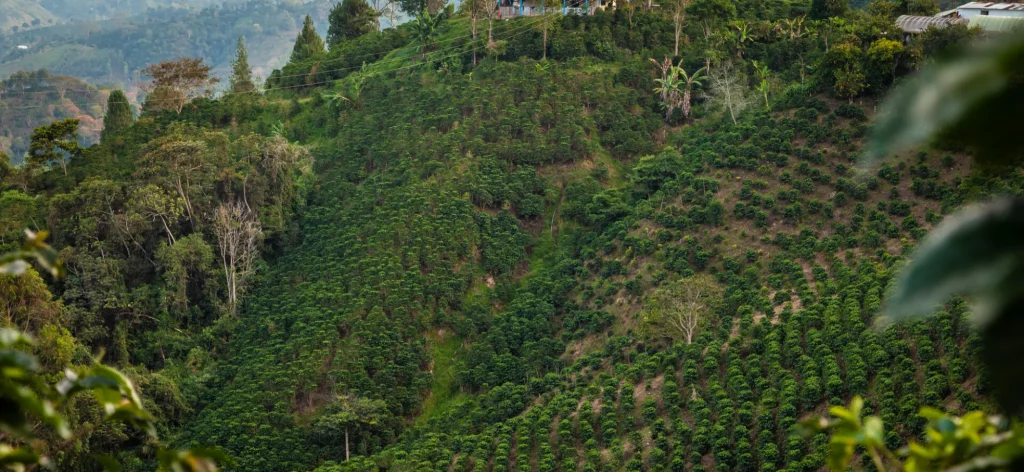
As an agricultural product, coffee is particularly vulnerable to climate change. In recent years, we have already observed some of its adverse effects, such as extreme temperatures, changes in precipitation patterns, droughts or last year’s frosts in Brazil. These effects threaten food security by altering the productivity of crop fields worldwide. It is estimated that even 50% of the worldwide coffee productivity could be reduced by 2050 (Grüter et al., 2022).
Consequently, one of our main concerns is the protection and conservation of the environment. Under objective eight of our Responsible Business Program, we want to analyze our group-wide environmental footprint and reduce carbon emissions along our coffee supply chain to enhance our overall environmental performance.
Methodology
To calculate our Corporate Carbon Footprint (CCF), we have used the Greenhouse Gas Protocol Corporate Standard (GHGPCS). The GHGPCS provides a framework for companies and organizations to compile their GHG inventory (WRI & WBCSD, 2015). By doing so, companies can learn more about their processes, identify critical sources of emissions and design lines of action focused on emissions reduction aligned with climate science.
Given that our business operations are very diverse, we have defined the following company profiles for the calculation of our CCF:

FARMS

EXPORTING

IMPORTING

SERVICE
As a next step, the base year of 2021 was determined for data collection. Particularly, within the GHG Protocol, emissions are broken down into scopes 1, 2 & 3 to cover different types of GHG generated through business operations.
The table below shows how the different scopes are defined and which emission sources we have identified for our corporate carbon footprint calculation:
Scope 1
covers all direct emissions caused by electricity generation, chemical or mechanical processing operations, and the transport of products and employees using corporate owned and leased assets.
- Use of fertilizers
- Land management
- Electricity generation
- Fuel combustion for operations
- Material transportation
- Employee transportation
Scope 2
includes indirect emissions resulting from the purchase of electricity consumed by the company.
Purchase of
- Electricity
- Heat
Scope 3
refers to other indirect emissions that occur within the entire value chain and are optional for reporting. For example, through the transportation of sold products or waste, employee business travel, or the disposal of purchased goods at the end of their useful life.
- Coffee farming
- Fertilizer and packaging production
- Fuel- and energy-related activities
- Upstream transportation of coffee and material
- Waste generation and transportation
- Water supply and treatment
- Business travel
- Employee transportation
- Coffee warehousing
- Upstream transportation of coffee
Although all the emission sources of Scopes 1 and 2 were considered for the calculation, for Scope 3 the boundary was defined as the moment of sale of the coffee by the NKG company in its different locations. This is because it is not possible to identify the path and processing followed by the coffee bean after its sale.
For the calculation our CCF, information from the following companies was collected due to data availability: 17 exporters, 17 importers, 5 service companies and 3 coffee farms. However, if structural changes will occur within the company in the future, the base year must be recalculated to enable effective comparisons.
Carbon Emissions
After analyzing the information collected and calculating the corresponding emissions from the different NKG companies, it was determined that a total 3,501,251 tons of CO2e were generated during 2021.
This result is the aggregate of the emissions generated by the 42 companies considered: 17 exporters, 17 importers, 5 service companies and 3 coffee farms. And as can be seen in figure 1, 99.3% of NKG emissions are due to Scope 3 emissions sources.
Loading..........
The Data is Not Available
Figure 1: Breakdown of NKG in 3 scopes for 2021.
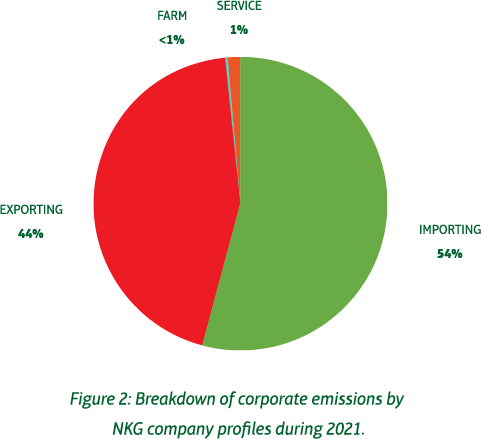
Considering the profile of our different companies, importing companies were responsible for 54% of the global corporate carbon footprint, while exporting companies generated 44% of our total 2021 emissions. Farming and service companies accounted together for less than 2% of the overall corporate carbon footprint.
In a more detailed way, for both importing and exporting companies, Scope 3 emissions accounted for more than 99% of their overall footprint. For the case of service companies, Scope 3 emissions represented 92% of their footprint. For the case of our farms, Scope 3 emissions represented 52% of their carbon footprint.
Scope 1
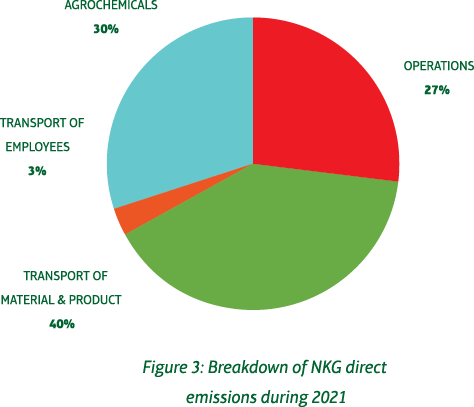
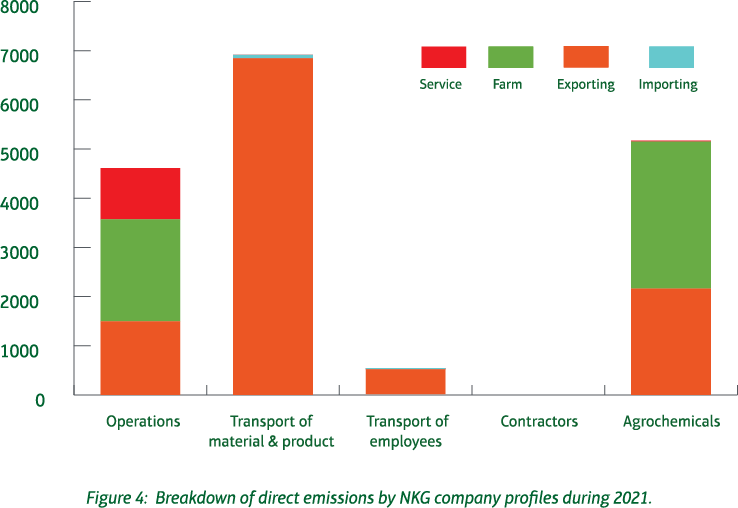
Compared to emissions generated along our value chain, Scope 1 was responsible for 0.5% of our total emissions in 2021. This means that 17,244 tons of CO2e were generated due to our own activities. Considering the 4 company profiles in NKG, 30% of direct emissions were due to the use and application of agrochemicals both in our coffee farms, as well as in exporting companies. Additionally, 27% of direct emissions in 2021 were generated due to the combustion of fossil fuels and biomass for the operation of equipment and machinery normally used to process coffee beans. Finally, 40% of the direct emissions generated were due to the burning of fossil fuels to operate vehicles used to transport materials and products, while only 3% of our direct emissions were due to the corporate vehicle fleet.
Considering the NKG profiles, figure 4 shows how our exporting companies are responsible for 62% of direct emissions due to the use of fossil fuels and biomass for operations, as well as vehicles for transporting material and products, and transporting employees with our own vehicle fleet. Our farms, on the other hand, are responsible for 31% of the direct emissions generated in 2021, mostly due to the use and application of agrochemicals, as well as fossil fuels for our own processing operations.
Scope 2
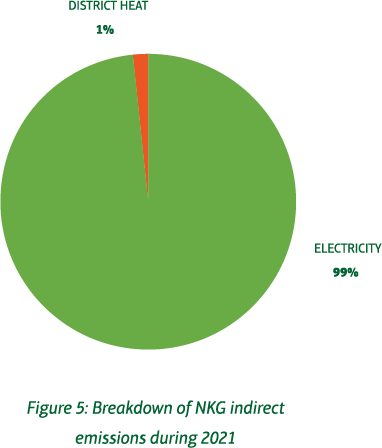
Scope 2 emissions generated represented 0.2% of our total carbon footprint during 2021. A total of 6,852 tons of CO2e were generated as indirect emissions due to the purchase of electricity and heating.
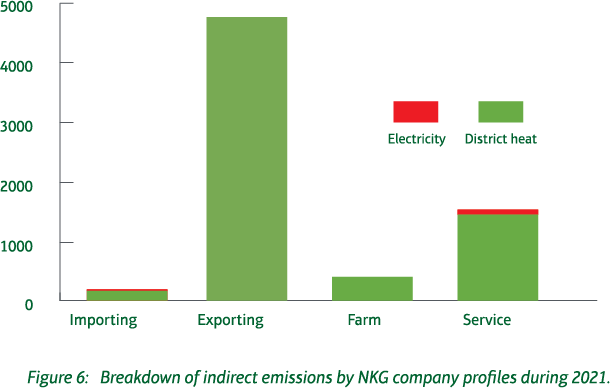
Considering the NKG profiles, 70% of indirect emissions are generated by our exporting companies due to the purchase of electricity, followed by service companies with 22% for both electricity purchase and heating.
Our coffee farms generate 5% of total indirect emissions, while importing companies only account for 2% of total indirect emissions due to electricity use.
Scope 3
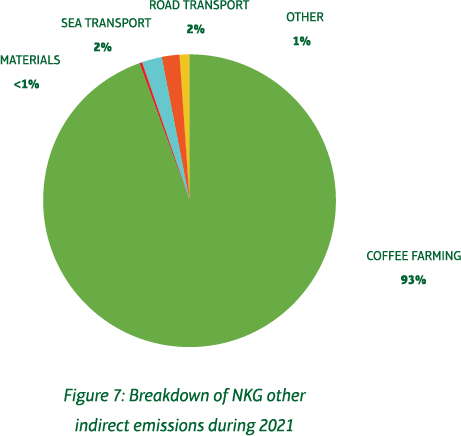
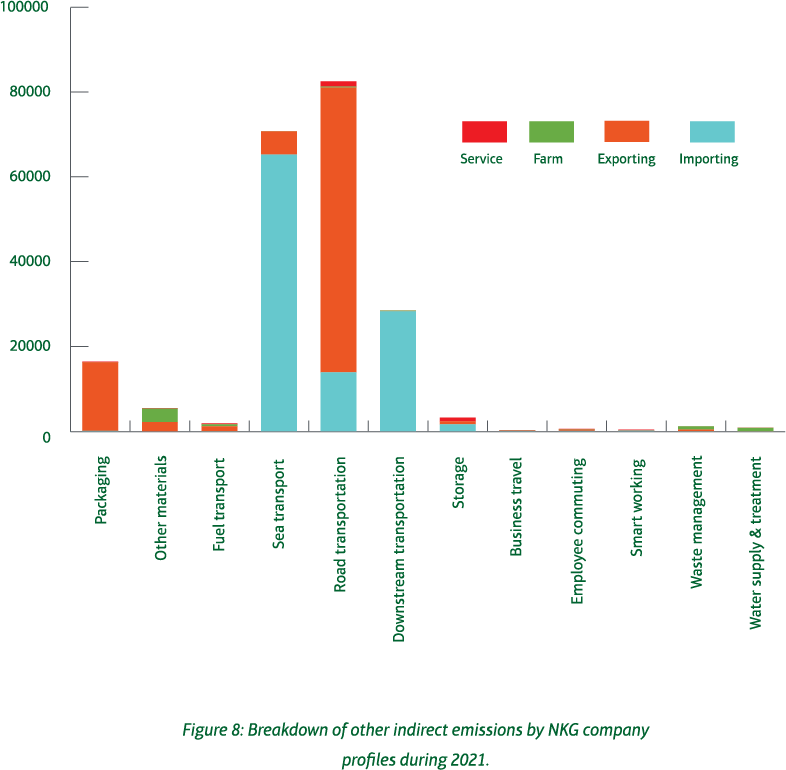
Other indirect emissions are generated due to activities along our value chain, which go from coffee farming activities up to the sale of coffee beans for further processing. Based on our overall corporate carbon footprint, 99.3% of our emissions were due to Scope 3 emission sources. In this sense, 3,476,750 tons of CO2e were generated as other indirect emissions due to activities along the value chain. As can be seen in figure 7, emissions generated from coffee-farming activities in the different coffee origins contributed 93.3% of our Scope 3 emissions in 2021. Looking into the company profiles, emissions generated by third-party coffee-farming activities were solely attributed to importing and exporting companies. On the other hand, the transport of coffee beans by land shipments belonging to us accounted for 2% of Scope 3 emissions, while maritime shipping contributed 2% of our other indirect emissions. The purchase of materials such as agrochemicals and packaging like jute and polypropylene bags for coffee transportation accounted for less than 1% of our Scope 3 emissions.
Looking in detail at the generation of emissions in our value chain, other than coffee farming by company profile, it is possible to observe that most of these come from sea and road transportation. While emissions from sea transport and downstream transportation were primarily generated by importing companies, exporting companies were responsible for generating most of the emissions from road transportation. Emissions generated by the purchase of packaging for coffee transportation were attributed to our exporting companies, while emissions from the purchase of other materials such as agrochemicals and fertilizers were due to the activities of our service companies, coffee farms and exporting companies.
Water
Part of our environmental footprint measurement also considers the use of water resources.
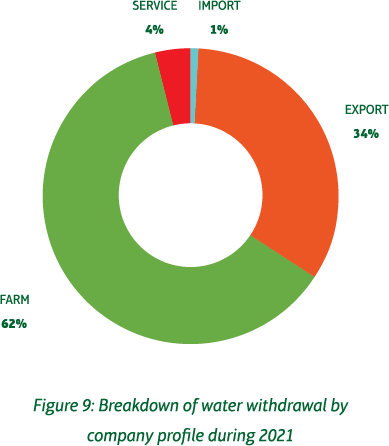
During 2021, a total of 227.3 million litres were withdrawn by the different company profiles to carry out their operations.
As shown in figure 9, 62% of the water withdrawn was for our 3 farms for different activities, such as irrigation, fertilizer application and coffee processing. Additionally, 33% of withdrawn water was due to the activities of export companies, particularly for washing and processing coffee before its commercialization.
Service companies, specifically KALA, were responsible for almost 4% of the water withdrawn in 2021 for coffee processing through steam. Less than 1% was withdrawn by our importing companies to provide sanitation and kitchen services.
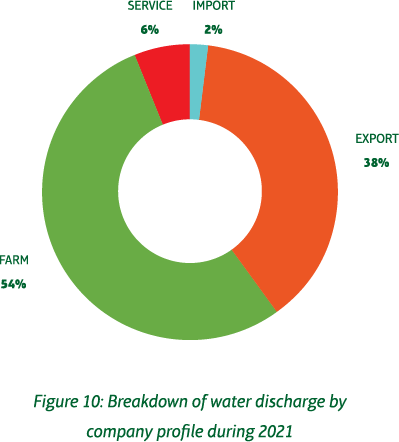
On the other hand, 95.6 million liters of good-quality water were discharged during the year 2021.
The largest amount of water discharged was due to washing activities within our farms, which were responsible for 54% of the discharged water after treatment. However, we have already water recirculation systems in place to reduce our water needs.
Our export companies, on the other hand, were responsible for 38% of discharged water due to coffee washing processes. Service companies, particularly KALA, led in water discharge with almost 6% of the total amount. Thanks to its own water treatment plant, it can ensure that final water quality is optimal for discharge.
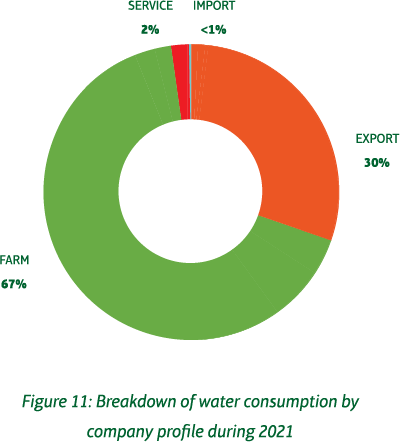
Finally, a total of 131.6 million liters of water were consumed by the different activities and processes carried out by our companies. This consumption refers to water used by NKG such that it is no longer available for use either by the ecosystem or the local community. In this regard, 67% of the water consumed was due to the activities carried out by our farms as part of their agricultural practices. Exporting companies accounted for 30% of the water consumed, while the KALA service company used nearly 2% of the total water consumed. The importing companies were responsible for using less than 1% of the water in 2021.
WaSTE
During the collection of information to measure our environmental footprint, we also emphasized the generation and management of waste by our companies.
From the activities carried out during 2021, we generated a total of 23.3 thousand tons of waste. Depending on the profile of the company, the amount and the management activity is different.
As it is described in figure 12, our 3 farms were responsible for generating 68% of the total waste, while the exporting companies contributed 29%.
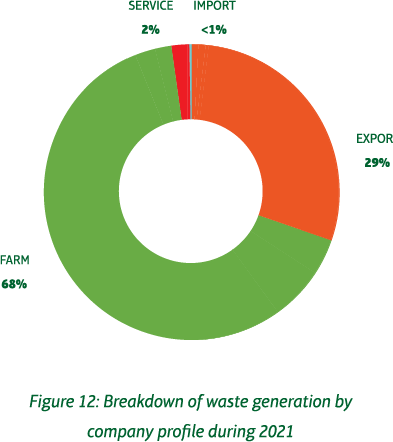
Service companies, particularly represented by KALA, generated only 2% of total waste, while import companies with office activities generated less than 1% of total waste.
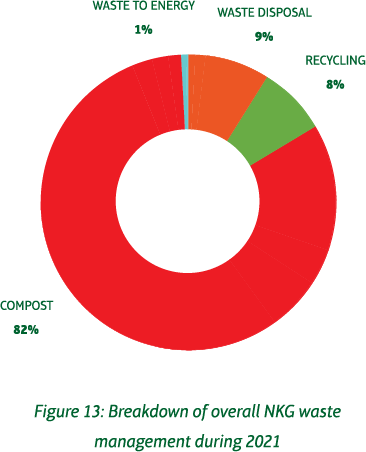
Figure 13 shows that 82% of the generated waste had an organic composition and was used for composting. Similarly, materials with the possibility of recycling were separated at the source and taken to points for proper management, representing 8%.
Only 1% of the waste generated and not segregated, particularly in our European companies, could be revalorized through waste-to-energy technology. This means that 9% of the total waste, due to the infrastructure of the countries where we operate, had to be disposed of without any recovery.
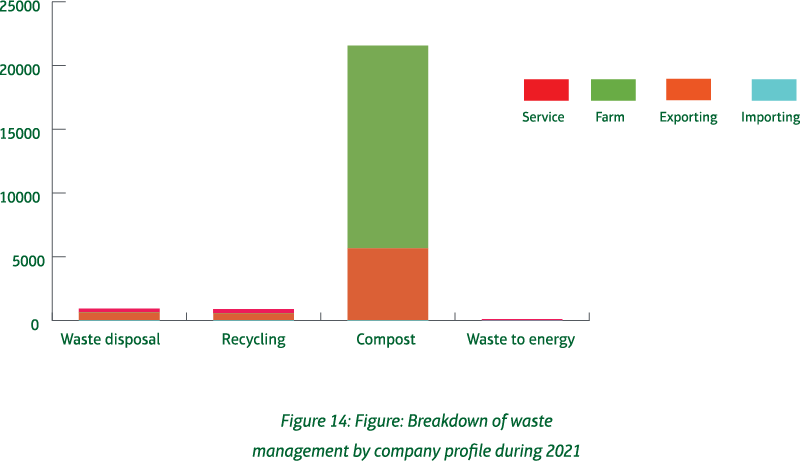
Figure 14 describes the amount of waste generated and managed by the different company profiles. The management of organic waste to produce compost was led by our farms and exporting companies, while segregation at the source for recycling and the final disposal of material in landfills was a practice of exporting companies due to the amount of generated waste and to infrastructure in the countries.
our next steps
The latest IPCC report clearly states that emissions must be reduced in all sectors in a rapid and steep manner to limit global warming to below 1.5°C. For this reason, we have focused our efforts primarily on knowing our environmental footprint for the year 2021, both in our own operations and in the value chain. Our corporate carbon footprint measurement exercise clearly shows which areas are critical to focus on in the short, medium, and long term. In the short term, we have foreseen the design and development of emission reduction plans based on energy efficiency, renewable energy, and circular economy practices to be implemented at our own facilities in 2023.
In particular, some group companies have already demonstrated their climate commitment. On the one hand, our export company CECA installed solar panels to generate renewable energy for its offices, NG Vietnam transitioned to a fleet of electric forklifts, and KALA is in the process of implementing heat recovery technology in its processes to reduce energy consumption. Some of our exporting companies such as Becamo and Berindo Jaya make use of coffee husks or palm kernel as biofuel to run their processes, while some of the coffee dust collected at KALA is used to generate biogas.
As part of our medium-term strategy, we plan to work with coffee producers in specific value chains to carry out best-agricultural-practices interventions that will lead to an increase in carbon sequestration as well as a reduction in overall emissions. These efforts include better traceability of coffee farming, transport, and processing activities in specific origins to ensure sustainable and low-carbon coffee value chains. Finally, considering that climate change threatens coffee productivity and availability worldwide, our long-term strategy foresees the enhancement of the coffee sector through the promotion and implementation of nature-based solutions with the intention of strengthening the adaptability of the coffee origins to extreme weather patterns, as well as regenerating such regions.
References
IPCC (2021): Summary for Policymakers. In: Climate Change 2021: The Physical Science Basis. Contribution of Working Group I to the Sixth Assessment Report of the Intergovernmental Panel on Climate Change [Masson-Delmotte, V., P. Zhai, A. Pirani, S.L. Connors, C. Péan, S. Berger, N. Caud, Y. Chen, L. Goldfarb, M.I. Gomis, M. Huang, K. Leitzell, E. Lonnoy, J.B.R. Matthews, T.K. Maycock, T. Waterfield, O. Yelekçi, R. Yu, and B. Zhou (eds.)]. Cambridge University Press, Cambridge, United Kingdom and New York, NY, USA, pp. 3−32, [Online]. Available at: https://www.ipcc.ch/report/ar6/wg1/downloads/report/IPCC_AR6_WGI_SPM.pdf
Grüter R., Trachsel T., Laube P., Jaisli I. (2022): Expected global suitability of coffee, cashew and avocado due to climate change. PLOS ONE 17(1): e0261976. [Online]. Available at: https://journals.plos.org/plosone/article?id=10.1371/journal.pone.0261976
WRI & WBCSD (2015): The greenhouse gas protocol: A Corporate Accounting and Reporting Standard. Revised edition. [Online]. Available at: https://ghgprotocol.org/sites/default/files/standards/ghg-protocol-revised.pdf
RELATED
sustainable
development
goals