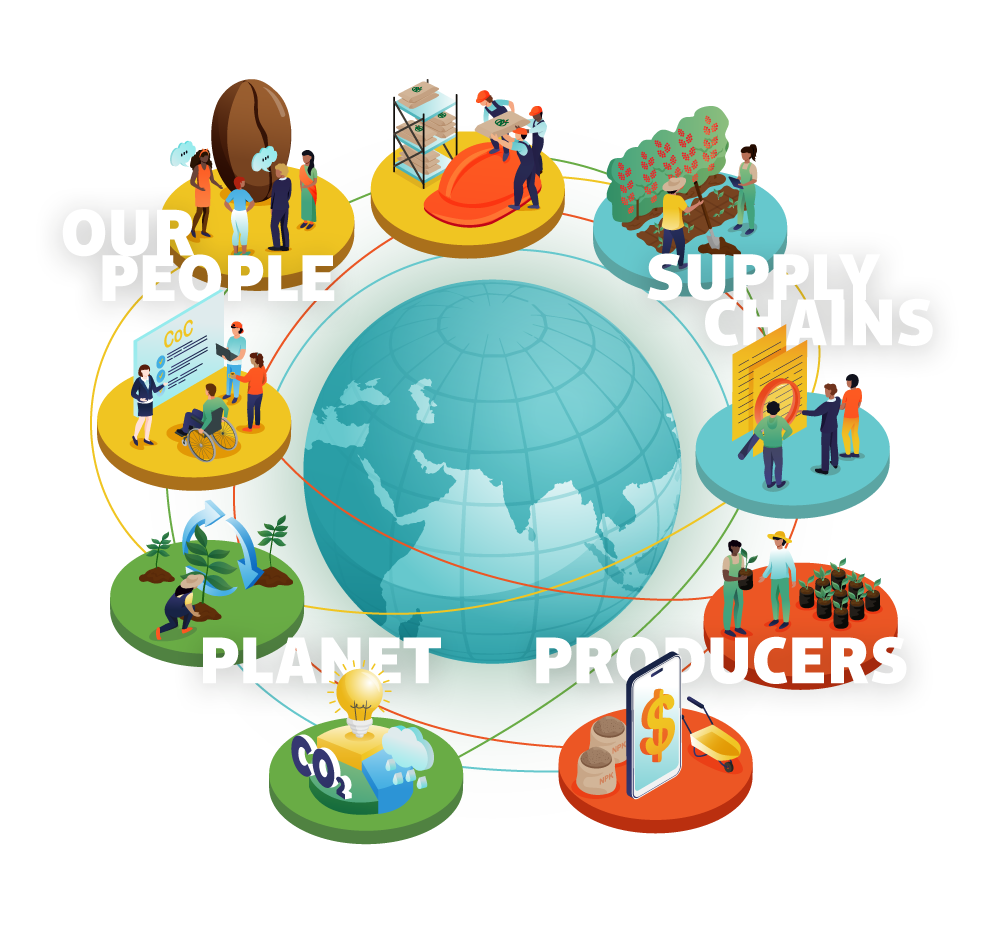
Planet
8
Measure and enhance our environmental performance
At NKG we recognize the urgent need to address climate change and to limit global warming. The corporate sector significantly influences global greenhouse gas emissions, giving companies a crucial role in protecting our climate and ensuring a seamless and successful transition to a low-carbon economy. Understanding the environmental impact of our operations is critical. As part of our Responsible Business Program, we prioritize assessing our environmental footprint and adapting our business model to support a low-carbon future.
Our Journey
Our journey towards measuring our environmental impact began in 2021 when we developed a robust methodology and calculated the carbon footprint of a pilot group of companies. We used the Greenhouse Gas Protocol Corporate Standard (GHGPCS)1 as a guideline to compile our GHG inventory. In 2022, we expanded this measurement to the entire group, publishing our first corporate carbon footprint (CCF) as a baseline in the NKG Sustainability Report 2022. This initial assessment highlighted areas for improvement in data quality and understanding. Consequently, we adopted 2022 as our new baseline due to its more comprehensive and accurate representation of our operations and emissions.
This chapter presents our updated 2023 corporate carbon footprint and compares it to our 2022 baseline. In the graphs, the inner circle represents our 2022 baseline, while the outer circle shows our 2023 corporate carbon footprint. In this way, we aim to clearly illustrate how the percentages of each category in our scopes have changed across the two different years.
Emission Sources Across the NKG Supply Chain

Given the diversity of our operations, we have illustrated our corporate carbon footprint and its boundaries in the graphic above. Our CCF calculation covers four different company profiles: our farms (focusing on coffee farming, nursery operations and forestry projects), exporting companies (handling coffee procurement and export coordination), importing companies (procuring coffee for importation and domestic sales), and service companies (processing, warehousing and handling diverse support functions). Emission sources across these profiles include direct emissions from electricity generation, processing, and transportation, in scope 1; indirect emissions from purchased electricity in scope 2; and a broad range of indirect emissions in scope 3 (e.g.; transportation, waste management, employee travel, and coffee farming).
Corporate Carbon Footprint
- Scope 1: contributed 0.4 % in 2022, and decreased to 0.3 % in 2023.
- Scope 2: contributed 0.2 % in 2022, and decreased to 0.1 % in 2023.
- Scope 3: remained the largest contributor, increasing from 99.4 % in 2022, to 99.5 % in 2023.
Overall, our total corporate carbon footprint increased from 3,366,727 tons of CO2e in 2022, to 3,732,410 tons of CO2e in 2023, a rise of 10.86 %. This is mainly due to higher purchases of goods and services, plus an increase in transportation activities and energy consumption. Despite this growth, the contribution of each scope in relation to our overall carbon footprint remained relatively stable in 2023.
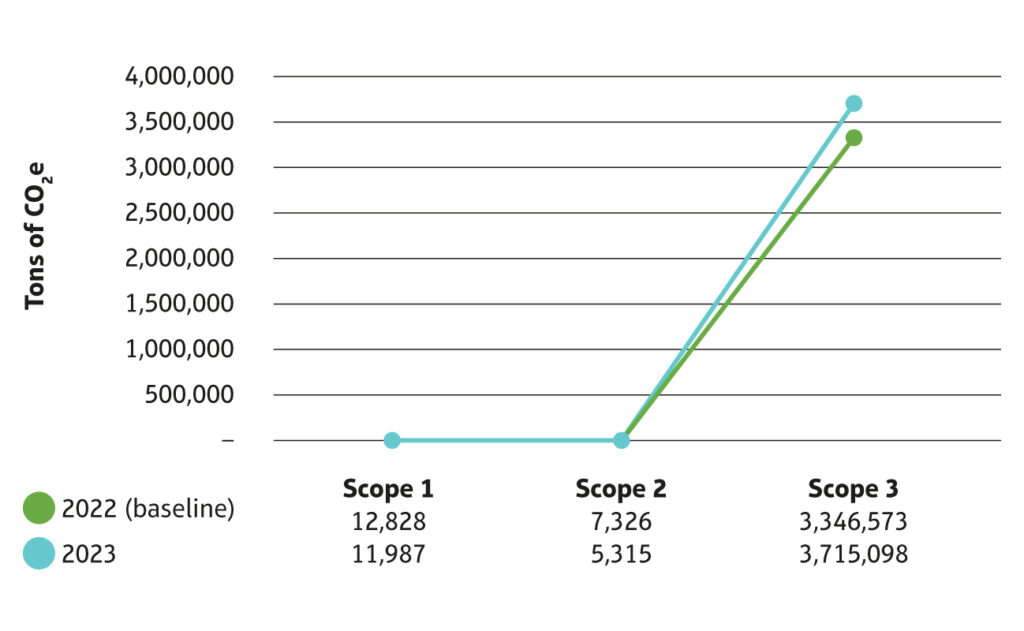
Figure 1: Breakdown of corporate emissions in 3 scopes.
Emission Breakdown by Company Type
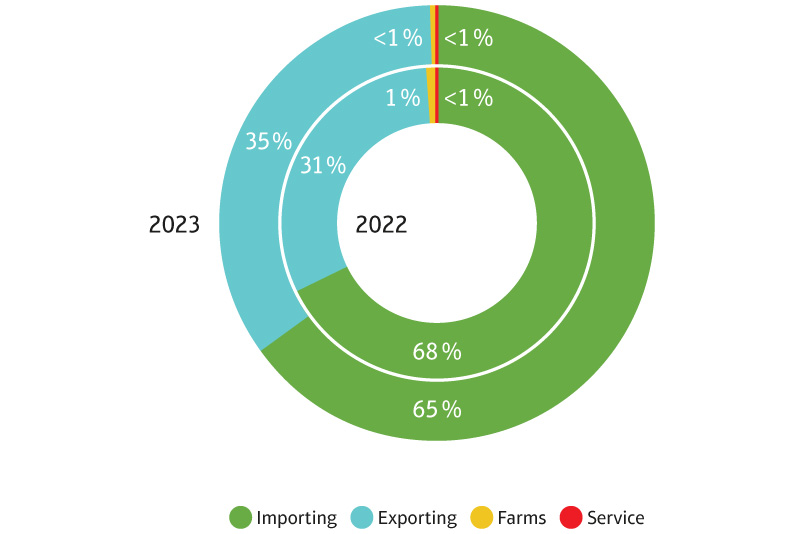
Figure 2: Breakdown of corporate emissions by company type.
The emissions breakdown by company type remained similar to our baseline, with importing companies representing the largest portion.
For importing and exporting companies, most emissions fall under scope 3 due to purchased goods and services. For farms, emissions are mainly in scope 1 because of the use of agrochemicals. Service companies, primarily warehousing, focus on scope 3 emissions caused by transportation.
Scope 1
As previously described, scope 1 emissions made up 0.4 % of our total emissions in 2022, and 0.3 % in 2023. This corresponds to 12,828 tons of CO2e from our direct activities in 2022. Out of these emissions, 97 % were attributed to the agrochemicals used on our farms. In 2023, our direct emissions decreased to 11,987 tons of CO2e. This was partly due to a 20.77 % reduction in emissions from agrochemicals, contributing to an overall 6.56 % drop in scope 1 emissions. During this period, fuel consumption for operations rose by 7 %, while emissions from transport fuel fell by 5 %.
The majority of our scope 1 emissions come from farm operations, followed by those from exporting companies and mills.
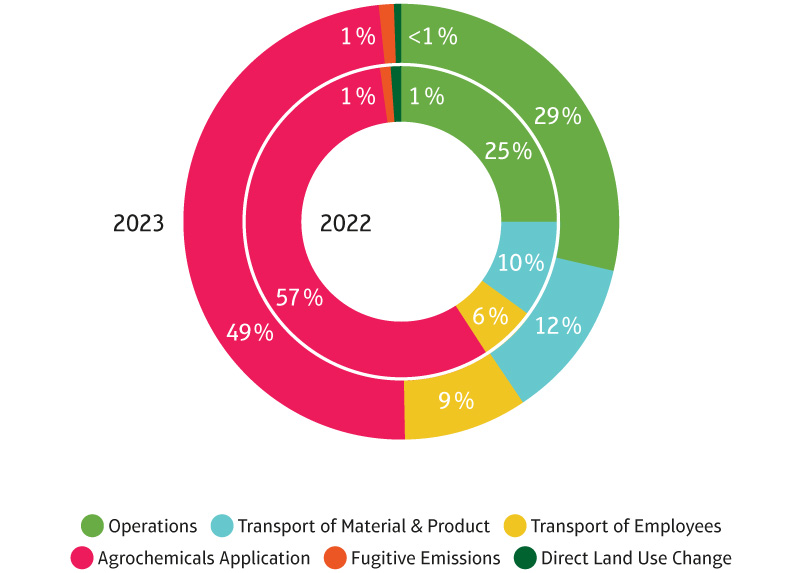
Figure 3: Breakdown of direct emissions in 2022 and 2023.
Scope 2
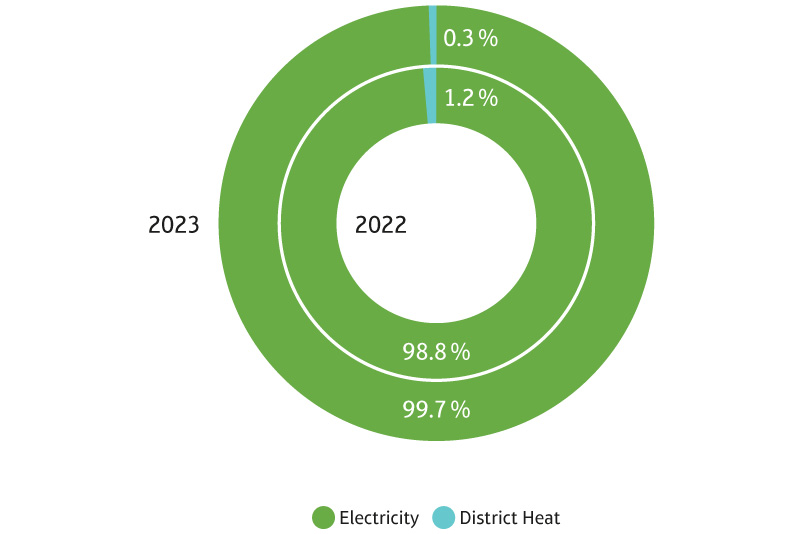
Figure 4: Breakdown of indirect emissions in 2022 and 2023.
In 2022, the majority of our scope 2 emissions came from electricity consumption, with a smaller share attributed to district heating. By 2023, scope 2 emissions decreased by 28 % thanks to a greater adoption of renewable energy. In total, the share of renewable energy in our electricity mix increased from 25 % in 2022, to 33 % in 2023, as more of our group companies worldwide started generating or purchasing renewable energy.
Scope 3
Indirect emissions arise from various activities across our value chain, including coffee farming, third-party transportation, and material manufacturing. In 2022, scope 3 emissions, which are by far the largest portion of our corporate carbon footprint, accounted for 99.4 % of our total emissions, amounting to 3,346,573 tons of CO2e. In 2023, this figure saw a slight increase, reaching 99.5 % of our total emissions, or 3,715,098 tons of CO2e.
A significant share of these scope 3 emissions comes from coffee farming. As illustrated in the graph, coffee farming alone contributed at least 90 % to our indirect emissions in 2023. These emissions grew by 8 % from 2022 to 2023, largely due to the business activities of our importing and exporting companies.
Product transportation is our second-largest emission category, representing 7 % to our overall corporate carbon footprint. Emissions from this category rose by 68 %, primarily due to increased coffee purchases and farming activities. Road transport, managed mostly by exporting companies, and sea transport, handled by importing companies, are the main sources of these emissions.
Material purchases, excluding coffee, are our third-largest emission source. This category saw a significant reduction of 40 %, now making up less than 1 % of our scope 3 emissions. This decrease is largely attributed to the reduced use of agrochemicals.
Overall, scope 3 emissions increased by 11 % compared to the previous year. As we gather and analyze more primary data, we will continuously refine our assessment of scope 3 emissions to better understand and address NKG’s environmental impact.
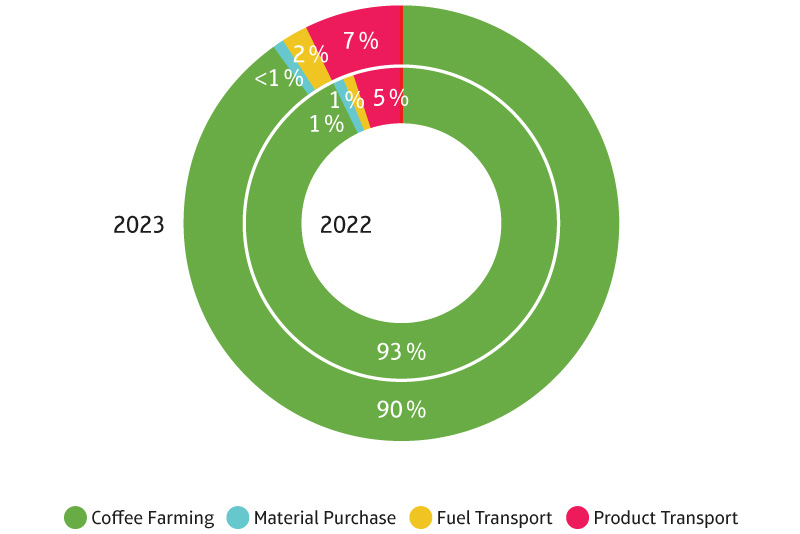
Figure 5: Breakdown of other indirect emissions in 2022 and 2023.

Climate Action Plan
- Measuring our baseline.
- Identifying key focus areas for our climate strategy.
- Designing a climate action plan (CAP).
Our climate action plan serves as a strategic framework to align our business strategies with a low-carbon economy, thereby reflecting our commitment to environmental responsibility. It emphasizes a number of mitigation and adaptation strategies, aiming to integrate climate change considerations into every aspect of our operations. This includes decisions on mill construction, farming practices implemented with our suppliers, and overall business activities. Our purpose-driven approach ensures that we not only reduce our climate impact, but also adapt effectively to current and anticipated changes while maintaining environmental sustainability and financial viability. By the end of 2023, we established internal targets to decrease our greenhouse gas emissions. As a first step in this journey, we committed to reducing our scope 1 and scope 2 emissions by 3 % in 2024 and by 6 % in 2025. These short-term targets reflect our expectation of an exponential shift towards low-carbon practices within our business, which is why we opted for a more modest reduction in 2024, followed by a more ambitious goal in 2025. For scope 3 emissions, we decided to delay the setting of specific reduction targets. Instead, we are focusing on enhancing and refining our Life Cycle Assessment (LCA) approach, particularly for our coffee farming emissions, which represent the largest part of our emissions. Additionally, we are working to improve the accuracy of our scope 3 data using primary sources, before committing to any reduction targets. To achieve our strategy and goals, our efforts are being concentrated on the following key focus areas:
Key Focus Areas
1. Greenhouse Gas Emissions
As part of our climate action plan, energy audits will be conducted across all our exporting companies to identify additional opportunities for emission reductions. Our group companies have started to actively work on decreasing transportation-related carbon emissions. So far, 16 % of our companies have implemented measures, such as increasing the use of biofuels, transitioning to lower-emission fuels, adopting electric vehicles, using employee carpooling, and optimizing transportation routes.
Additionally, we have already improved energy efficiency in 35 % of our group companies through technological advancements and equipment upgrades. We will continue to prioritize this matter in order to significantly reduce our emissions.
2. Energy Consumption
Through the efforts of 12 of our group companies, we have successfully increased the proportion of renewable energy in our electricity mix from 25 % to 33 % between 2022 and 2023. A key focus of this effort is expanding on-site solar panel projects at our exporting companies and farms.
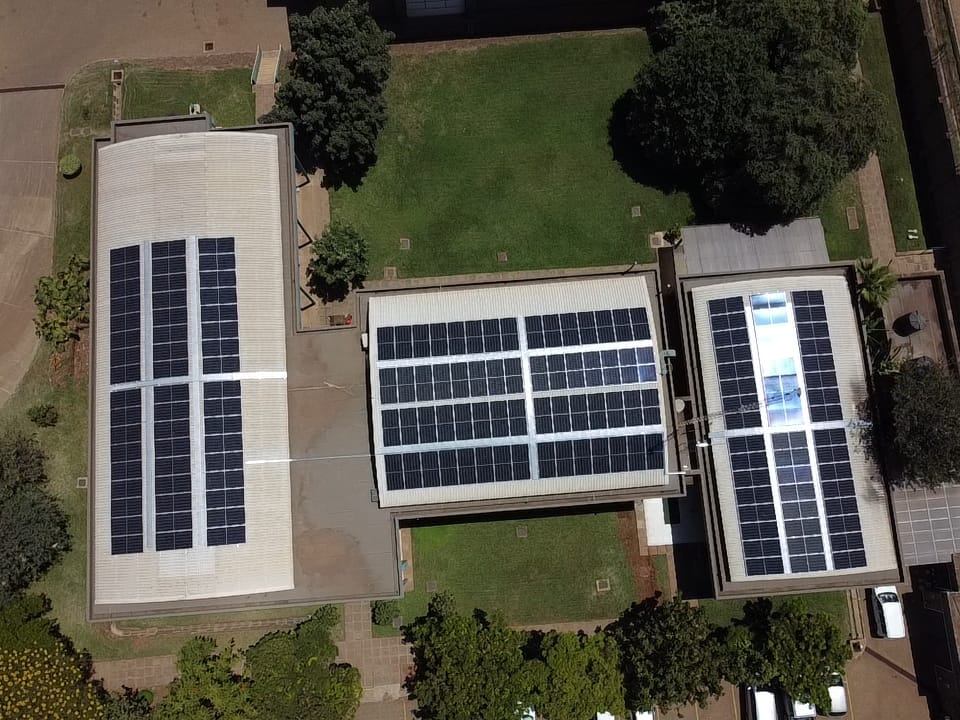
SPOTLIGHT
Solar Project at NKG East Africa
One notable example showcasing NKG’s commitment to climate action and environmental protection is the solar project at NKG East Africa, our regional headquarters in Nairobi. This initiative is the first of its kind in our regional portfolio and has been established in partnership with Equator Energy. This project enables us to significantly reduce our carbon footprint and to save water that would otherwise be used for the operation of thermal power plants, one of Kenya’s main sources of electricity: Through every kWh of solar energy consumed from the project, we avoid ~1 kg of CO2 and save ~0.05 liters of water, ensuring a guaranteed saving from the discounted rates.
AT NKG EAST AFRICA WE HAVE EMBRACED A TRAJECTORY TO MITIGATE OUR IMPACT ON CLIMATE CHANGE AND ADAPT OUR BUSINESS TO THE CURRENT AND EXPECTED CHANGES. WE ACKNOWLEDGE THE GREATER CONTRIBUTION OF THE SUPPLY CHAIN (SCOPE 3) EMISSIONS TO OUR FOOTPRINT BUT ARE ALSO CERTAIN THAT CHANGE MUST START FROM OUR IN-HOUSE OPERATIONS (SCOPE 1 & 2 EMISSIONS). AT NKG, WE ARE ALL ABOUT COFFEE AND WILL PROTECT THIS PRECIOUS COMMODITY FROM THE IMPACT OF CLIMATE CHANGE.
Melyne Amolloh, Regional Responsible Business Program Manager, East Africa
3. Raw material sourcing
Over the past months we have expanded our monitoring efforts to include raw material sourcing as we aim to reduce the environmental impact of our coffee export packaging. In 2022, 87 % of our packaging consisted of jute bags, while plastic packaging made up just 13 %. In 2023 we reduced the use of plastic packaging to just 10 %. Our transition to biodegradable Ecopil bags is another important step towards minimizing plastic waste and protecting the environment. These bags decompose naturally without leaving harmful microplastics, therefore safeguarding ecosystems.
4. Water usage
A water footprint is a crucial tool for assessing freshwater use, covering both direct and indirect consumption by consumers and producers alike. For corporations, the water footprint represents the total volume of freshwater used directly or indirectly throughout operations. This includes two key components:
- Operational (direct) Water Footprint: The water that a business uses and contaminates through its own activities.
- Supply Chain (indirect) Water Footprint: The water that is used or polluted to produce the goods and services that a business relies on.
The corporate water footprint combines blue, green and grey water footprints. This approach adheres to the Water Footprint Assessment Manual by the Water Footprint Network2 and is typically measured as a volume of water per unit of time within a specific area or region.
- Blue Water: Fresh surface and groundwater, such as water from lakes, rivers and aquifers, which is abstracted and not returned to the original source.
- Green Water: Rainwater used for consumption that does not contribute to runoff.
- Grey Water: An indicator of freshwater pollution, linked to the production of goods throughout their supply chain.
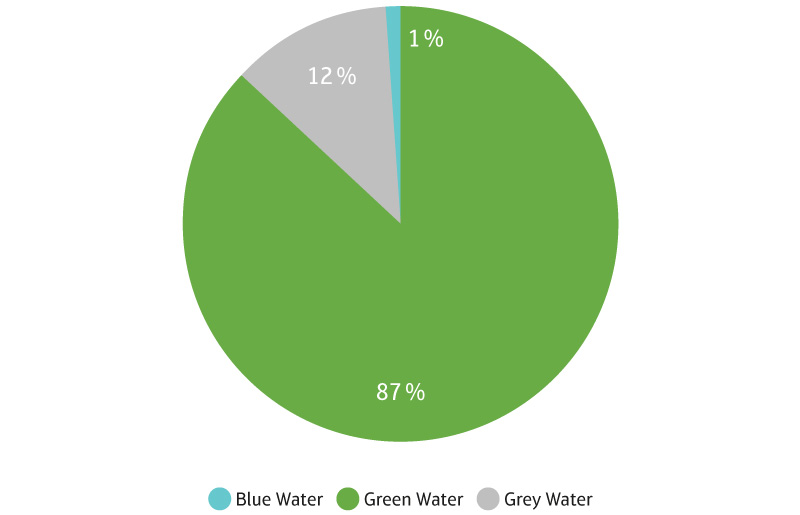
Figure 6: NKG Water Footprint 2023.
We calculated our direct corporate water footprint in 2022, including blue, green and grey water for the first time. We consumed 193.31 million liters of blue water, 28,115.22 million liters of green water, and 4,012.97 million liters of grey water. In 2023, blue water consumption increased by 11 %, and grey water by 0.5 %. However, the composition of our water footprint remained equal between 2022 and 2023.
To address our levels of impact, we are implementing various water conservation measures across our operations: In Mexico, Brazil and Peru, our dry-mill facilities are engaging in water conservation through wastewater treatment and recycling, which reduces the discharge of water into sewer systems and natural bodies. In Indonesia, we utilize semi-washed processing, as well as recycling water to minimize waste.
In Mexico, we also use artificial dams to ensure efficient water usage and to adhere to regulatory standards for water quality, while reintegrating treated water into natural bodies. In Uganda and Honduras, we focus on monitoring borehole water usage and employing biodigesters for natural treatment. In Costa Rica, our well-designed recirculated water system, complemented by third-party treatment processes, supports our wet-mill operations. Additionally, in India, we prioritize responsible wastewater containment and treatment in septic tanks to prevent discharge into sewer systems.
All these efforts reflect our dedication to reducing our corporate water footprint and promote sustainable water use throughout our global operations.
5. Waste generation
In 2022, we generated 9.6 thousand tons of waste. Of this total, 76 % ended up in landfills, 20 % was composted, and 4 % was recycled. In 2023, our overall waste quantity remained relatively stable, with minimal changes in waste management practices. However, we increased the portion of waste that was diverted to energy recovery.
In the future, we want to focus on innovative approaches to repurpose and reuse materials throughout our operations. Several of our exporting companies, for example, use coffee husks as a biofuel resource, while reducing waste and providing a sustainable energy source.
Additionally, Neumann Gruppe USA has partnered with GrainPro to facilitate the collection and recycling of hermetic coffee bags. This initiative helps to divert packaging waste from landfills and encourages reuse and recycling within the coffee industry.
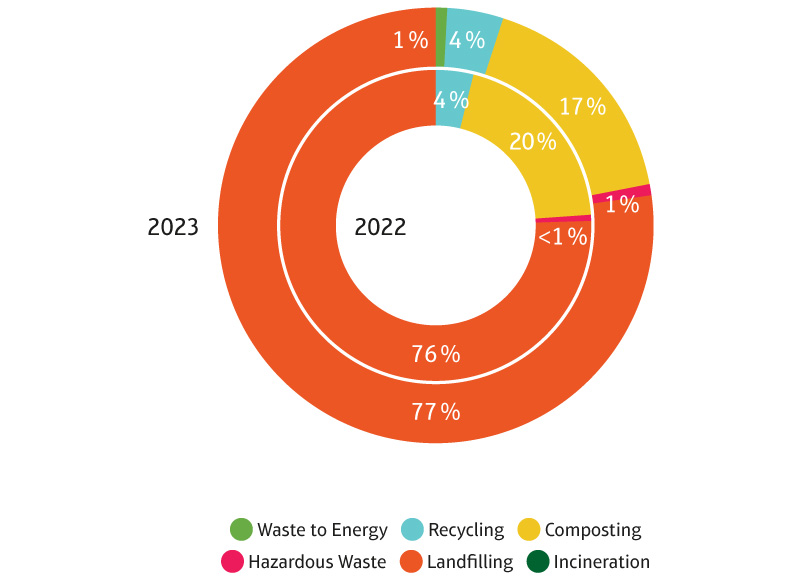
Figure 7: Breakdown of waste management at NKG in 2022 and 2023.
Conclusion
In 2023, we made remarkable progress in reducing our emissions, achieving a 7 % reduction in scope 1 emissions and an impressive 27 % reduction in scope 2 emissions. These significant milestones were mainly driven by our farm initiatives and the increased incorporation of renewable energy into our electricity mix. The results of our 2023 corporate carbon footprint exceeded our envisioned reductions targets, revealing that changes within our group occurred faster and on a larger scale than we had anticipated. The major decrease in scope 2 emissions was largely due to projects already in progress, while further reducing scope 1 emissions remains a challenge.
Looking ahead, our climate action plan outlines our commitment to continued reductions in 2024 and 2025. We are actively working on initiatives such as conducting energy audits, performing environmental risk assessments, implementing recommended measures across our exporting companies and farms, and expanding our renewable energy projects.
For scope 3 emissions, while we continue to enhance our access to primary data, we have also started exploring potential emission reduction projects in key areas such as transportation and waste management. These efforts are part of our broader strategy to achieve meaningful and lasting emission reductions across our entire supply chain.
References
1WRI & WBCSD (2015): The greenhouse gas protocol: A Corporate Accounting and Reporting Standard. Revised edition. [Online]. Available at: https://ghgprotocol.org/sites/default/files/standards/ghg-protocol-revised.pdf
2Hoekstra, A.Y., Chapagain, A.K., Aldaya, M.M. and Mekonnen, M.M. (2011): The Water Footprint Assessment Manual: Setting the Global Standard. [Online]. Available at: TheWaterFootprintAssessmentManual_English.pdf
RELATED
sustainable
development
goals